Fall Product Drops
Fall is here, and so are a host of new ObservePoint features. We’ve been busy building tools that make it easier than ever to monitor, manage, and optimize your site. Here’s a quick rundown of what’s new and improved.
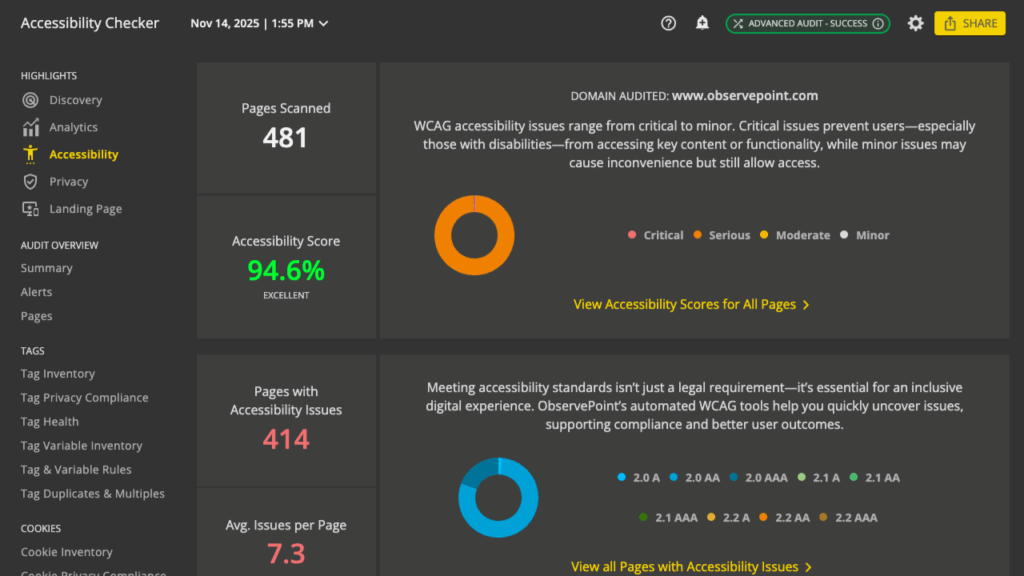
Accessibility Highlight Report & Updates to Account-Wide Reports
See all your accessibility issues in one place with scoring and easy-to-understand widgets and descriptions.
What It Is
Updates to the Accessibility Account-Wide Reports and a new Accessibility Highlight Report helps users quickly understand accessibility compliance and prioritize fixes with greater confidence and impact.
- New Score Widget on Page Details: Displays Accessibility Score next to Total Page Issues, colorized using the scoring thresholds.
- New Accessibility Highlight Report: will help users quickly understand accessibility performance and prioritize fixes with greater confidence and impact.
- New Columns on Account-wide Pages:
- Accessibility Score: Users can choose one or many scores to evaluate their accessibility.
- Failure Count: The number of failing HTML elements on a page, only counts elements that are evaluated.
- Pass Count: The number of passing HTML elements on a page.
- New Columns on Account-wide Accessibility:
- Accessibility Issue Category: Groups all issue types into one of fifteen categories.
Why You’ll Like It
- Scoring: Weighted scoring surfaces pages with the most critical accessibility issues first, helping teams focus on the fixes that matter most.
- Highlight Report: Purpose-built report visualizes WCAG violations by type, severity, and page, so teams can see coverage at a glance.
- Mobile first design: Optimized for mobile devices, the highlight report is fully responsive, making it easy to review and share accessibility results during early stage onboarding.
Browser Console Logs Report
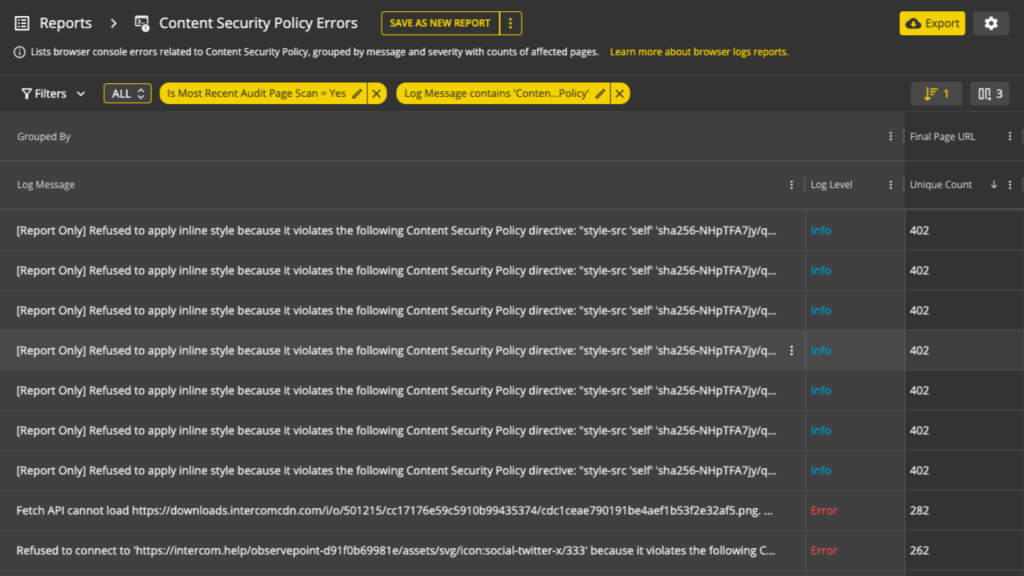
Automatically capture and analyze browser console errors to improve performance, compliance, and user experience.
What It Is
Modern websites depend on complex JavaScript frameworks and third-party tags, which can introduce hidden issues like broken resources, security warnings, or silent performance errors. These console errors often go unnoticed because they are only visible through manual browser inspection, and many QA or marketing teams do not have easy access to developer tools.
The new Browser Logs Report automatically captures, categorizes, and surfaces browser console messages during audits. This gives digital, marketing, and development teams clear visibility into technical errors that affect site performance, compliance, and user trust.
Why You’ll Like It
- Visibility: Surfaces hidden console errors that can impact performance, SEO, and analytics accuracy.
- Efficiency: Saves development and QA teams hours of manual browser inspection across pages, devices, and locations.
- Trust and compliance: Flags security-related issues such as mixed content, blocked scripts, and cookie warnings.
- Actionable context: Each log is tied to the page, tag, audit, and script source for straightforward debugging.
- Scalability: Captures and monitors errors across entire site scans instead of limited samples.
How It Works
- Create a Test Configuration (formerly called a Device) and apply your Tag & Variable Rules.
- Upload HAR files to analyze and validate them against that configuration. Multiple HAR files will be automatically split into multiple steps.
- Each upload generates a Session (formerly called a Journey).
- Review results in a familiar, streamlined reporting interface — the same intuitive view you know from Audits and Journeys.
Read the help doc for more details.
HAR Analyzer
A smarter, faster way to analyze and validate your HAR files.
What It Is
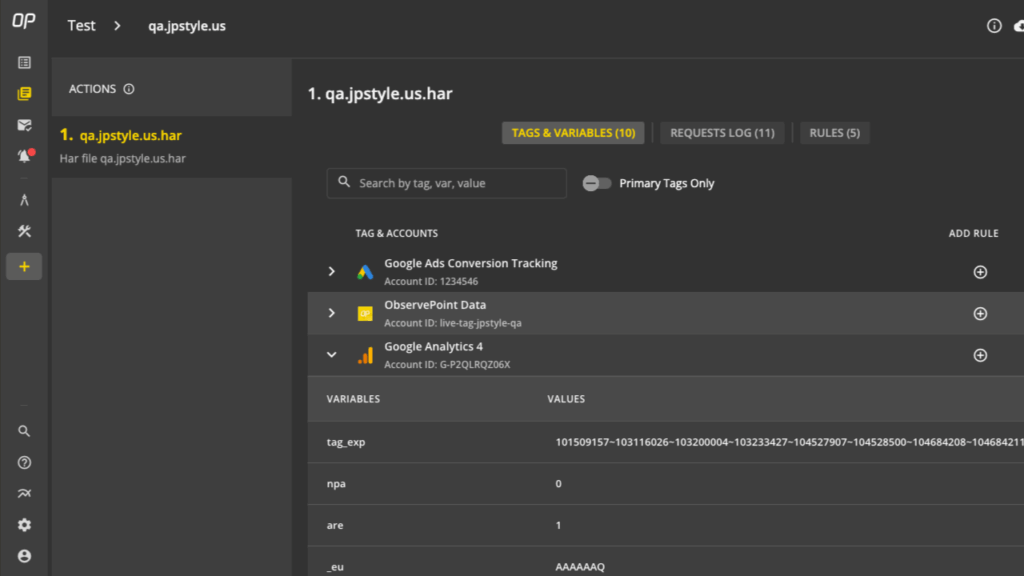
Say hello to HAR Analyzer, the next evolution of HAR Upload. With a complete UI redesign and expanded capabilities, HAR Analyzer makes it easier than ever to upload HAR files, then validate and analyze the network requests, tags, and data they load. (ObservePoint automatically analyzes and applies tag rules.) The new experience aligns with familiar Audit and Journey layouts, giving you instant clarity and consistency across your workflow.
Why You’ll Like It
- Streamlined setup, faster insights: A clean, intuitive interface gets you from upload to analysis in minutes.
- Actionable validation: Review tags and variables with fewer clicks, all in a modernized reporting view.
- Now a standalone product: HAR Analyzer has been decoupled from LiveConnect, giving you flexible access and new pricing options.
How It Works
- Create a Test Configuration (formerly called a Device) and apply your Tag & Variable Rules.
- Upload HAR files to analyze and validate them against that configuration. Multiple HAR files will be automatically split into multiple steps.
- Each upload generates a Session (formerly called a Journey).
- Review results in a familiar, streamlined reporting interface — the same intuitive view you know from Audits and Journeys.
Read the help doc for more details.
LiveConnect
A refreshed interface for smoother testing and analysis across devices.
What It Is
LiveConnect has long been a powerhouse for advanced testing, especially when validating tag behavior across different device types. Now, it’s getting a well-deserved upgrade. The new LiveConnect interface brings a modern, intuitive design consistent with the rest of the ObservePoint platform, streamlining setup and making results easier to interpret than ever.
Why You’ll Like It
- Modernized for usability: A sleek, refreshed UI that matches the look and feel of the full ObservePoint experience.
- Simpler setup, clearer results: Navigate configurations, run tests, and analyze outcomes faster, all within a familiar layout shared with Audits and Journeys.
- Optimized for technical users: Perfect for validating across device types or testing in lower environments beyond scanner reach.
How It Works
- Create a Configuration (formerly called a Device) and apply your Tag and Variable Rules.
- Set up your target device for testing by installing the required certificate and obtaining any necessary approvals.
- Initiate a Session (formerly called a Journey) to record, analyze, and validate your test results against that configuration.
- Review results in a reporting view consistent with Audits and Journeys for a seamless, unified experience.
Read the help doc for more information.
Request a Tag
Easily request new tags right from your reports; no support ticket required.
What It Is
As web technologies evolve faster than ever, keeping up with them can be a challenge. Previously, adding the technologies you want tracked to ObservePoint required internal support requests. With the new Request a Tag feature, users can now submit tag requests directly from within the product and track their progress from start to finish.
Why You’ll Like It
- Faster access to new tags: Skip the wait for manual support tickets and get new tags added quickly.
- Self-service empowerment: Request tags directly from reports, no extra steps or dependencies required.
- Built-in visibility: Track the status of your requests in real time for full transparency.
- Greater agility: Stay up to date with the rapid pace of new web technologies and tracking tools.
- Better experience: Enjoy a smoother, more modern workflow that fits naturally into how you already use ObservePoint.
How It Works
- From an Audit Page Details or Journey Request Logs report, click the Request Tag icon next to any network request.
- Fill out a short form with key details:
- Tag Name
- Tag Vendor
- Purpose of the Tag
- Category of the Tag
- Submit your request and monitor its progress under Support → Request Tags to see when it’s added to the ObservePoint platform.
Read the help doc for more details.
Report Linking & Drilling
Seamlessly move from big-picture insights to detailed data without losing context.
What It Is
ObservePoint reports are already powerful for surfacing insights, but understanding why something’s happening can require extra digging. The Report Linking & Drilling feature enables faster, more connected analysis, so you can act on your data. It allows users to click on an insight from one report – for instance, the count of pages where a specific tag is found – and be directly navigated to the pages report displaying those exact pages.
Why You’ll Like It
- Faster analysis: Move effortlessly from high-level insights to granular details.
- One-click navigation: Jump directly from a summary metric to the specific pages or data points behind it without manual filtering.
- Dynamic drill-downs: Ungroup and filter reports in place to isolate what matters most without additional queries.
- Streamlined workflow: Spend less time moving back-and-forth between reports and more time taking informed action.
How It Works
- Access the 3-Dot Menu: Hover over a cell and click the 3-dot menu (or right-click on the cell) to open available actions.
- Drill Within the Current Report:
- Available only in grouped mode on non-grouped-by value cells (e.g., aggregate or pivot columns), “Drill into this group” from the menu.
- This will automatically apply filters and ungroup the report as needed, focusing on the relevant data segment without leaving the current view.
- Navigate to Linked Reports:
- Some data will redirect you to a different report.
- The target report will automatically load with appropriate filters already applied, streamlining your workflow.
- View Page Details: Clicking directly on an individual URL within a report opens the familiar Page Details view for deeper inspection.
- Audit and Journey Report Links: Certain columns (such as the “Audit” column in the Web Audit Runs report) will display links that take the user directly to an Audit or Journey report.
Read the help doc for more info.
API Docs Refresh
A modernized API documentation experience built for faster learning and easier adoption.
What It Is
ObservePoint’s API documentation has moved to a modern platform designed to improve usability, interactivity, and scalability. The new experience centralizes all API information in one place, making it easier for both technical and non-technical users to explore, test, and learn.
Why You’ll Like It
- Unified API experience: All API references, examples, and recipes are now consolidated into one central hub.
- Interactive testing environment: Test endpoints and view examples directly within the documentation, without additional setup.
- Improved developer experience: Clear structure, syntax highlighting, and powerful search make it easier to find what you need.
- Increased API adoption: With a smoother onboarding and learning flow, more users can explore and apply ObservePoint APIs quickly and confidently.
How It Works
Take a look at the information in the API documentation.
Cookie Report in Debugger
Now you can find all cookies in the ObservePoint Debugger.
Read the standalone blog for details on this exciting development.
Hope you enjoyed this feature round-up. Stay tuned for more releases as we continue to improve the platform for your business needs. If you aren’t a customer yet, hop on over to a Free Trial and explore ObservePoint for yourself.


