A Chrome & Edge Extension to Debug Your Tags, Cookies & Accessibility issues
ObservePoint Debugger is a free Chrome extension for inspecting analytics, marketing, and measurement tags—plus all browser cookies—on any page. Now featuring WCAG accessibility testing and GPC signal verification, you can easily ensure your site is inclusive, secure, and privacy-compliant as you browse.
Trusted by the World's Most Trusted Brands


0
Pages Scanned
0
Users
Debug all Adobe and Google products and 1000's mooooore.

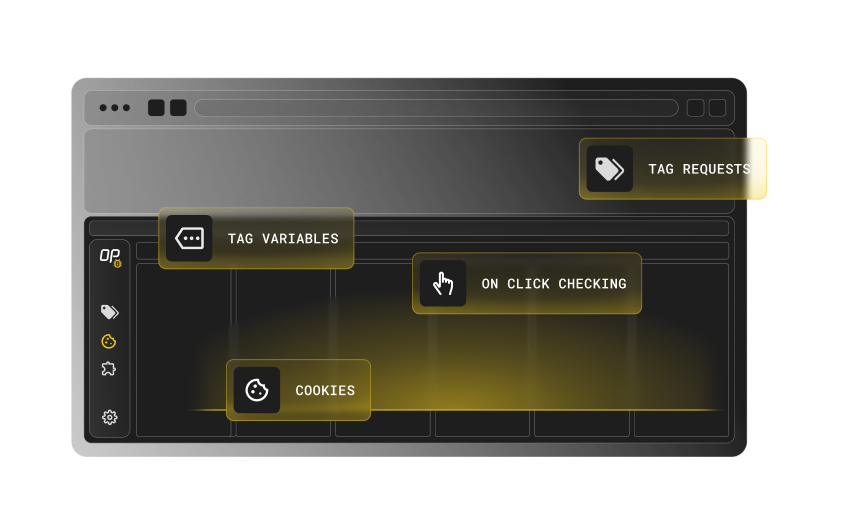
Perform quick tag checks on individual pages

Inspect the variables for each tag

Monitor on-click events

Export your browsing session to Excel
Want to get a free account instead?

How Do I Use the ObservePoint Debugger?
Step 1
Request access to the ObservePoint Debugger and install from the Chrome Webstore
1
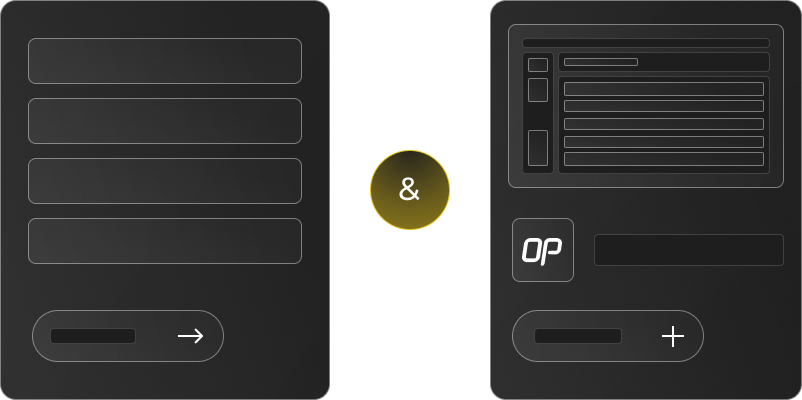
Step 2
Open Chrome’s
Developer Tools and open the ObservePoint panel.
2
Step 3
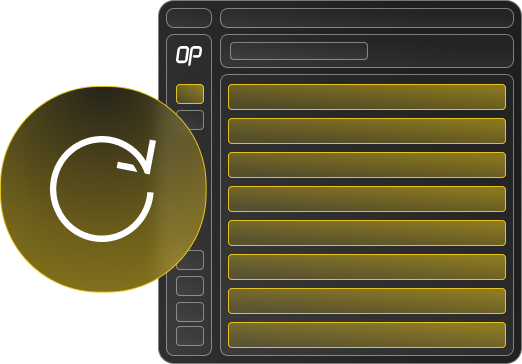
Reload the page to see tags load.
3
Compatible with both Google Chrome and Microsoft Edge
Debug with confidence in your preferred browser—Chrome or Edge.

Get the debugger in the Chrome Web Store
Install on Chrome
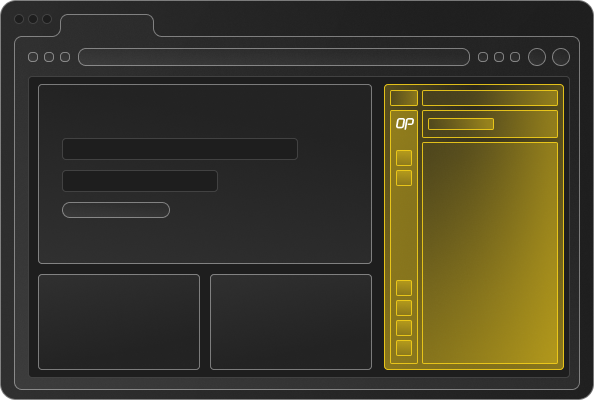
Inspect analytics and marketing tags
View and analyze browser cookies
Audit tag details and variables
Supports all major tag vendors
Export data to Excel
Monitor on-click and event requests
Scan for WCAG Accessibility Issues
Test your site with GPC Signal
Frequently asked Questions (FAQs)
- What is a website debugger? keyboard_arrow_down
- A debugger is a tool that captures and displays all network requests made by your site, so you can see what’s firing, when, and if it’s working correctly.
- What can I use the ObservePoint Debugger for? keyboard_arrow_down
- You can use it to verify analytics tags, ad pixels, consent management scripts, performance requests, and other third-party technologies across your web pages.
- How is this different from Chrome DevTools or other free debuggers? keyboard_arrow_down
- Unlike browser consoles, ObservePoint Debugger is built specifically for marketers and analysts. It organizes network requests, highlights tracking issues, and connects directly to your account for deeper validation.
- Does the Debugger work with my consent management platform (CMP)? keyboard_arrow_down
- Yes. It shows you whether consent banners are correctly blocking or allowing tags, making it easy to spot compliance gaps.
- Can ObservePointDebugger be used as an Adobe Analytics debugger? keyboard_arrow_down
- Yes. The ObservePointDebugger Chrome extension recognizes all Adobe products in the Adobe Experience or Marketing Cloud, capturing the details of any data collection and parsing the data into a human readable format for easy debugging. For Adobe Analytics, the ObservePointDebugger can parse both GET and POST requests.
- Can I share Debugger results with my team? keyboard_arrow_down
- Yes. Debugger sessions can be saved, exported, and shared so teams can collaborate on fixing issues quickly.
Tired of manually tracking cookies, tags, and pages?
Automatically audit and monitor your analytics, key customer journeys, and privacy programs.