ObservePoint’s Hot Product Summer


This summer, ObservePoint leveled up in more ways than one. We’ve rolled out a wave of new features to make monitoring and maintaining your website simpler, smarter, and faster. Here’s a quick look at what’s new in case you missed it.
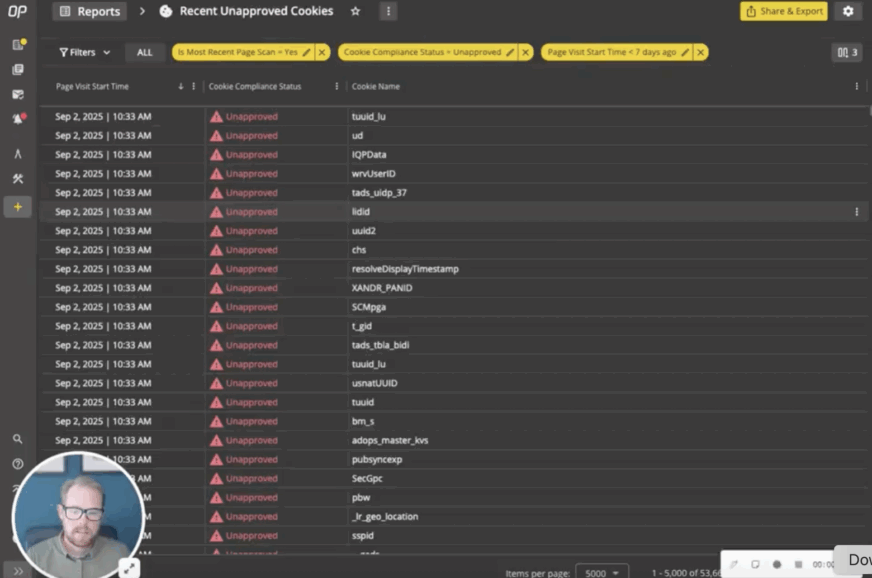
NEW REPORT TYPES
1. Links Report
Get all hyperlink data across Audits in one report.
What It Is
A centralized report of all the links on all pages, from all websites, across your entire account.
Why You’ll Like It
- Instantly identify broken, redirected, or dead links without manual checks.
- See all links discovered in your Audit, including the source location (e.g. which page and element) and destination.
- Integrate into QA workflows without going through multiple Audit or Page reports separately.
How It Works
During an Audit, ObservePoint captures all hyperlinks on every scanned page. The Links Report aggregates this information to show:
- The page the link was discovered on
- The element or source that is linked (e.g., text, button, image)
- The destination URL: the full HTML link so you can find it on the page
- Link status (working, redirected, broken, etc.)
- HTTP response codes
- Final resolved URL if redirects are involved
This report is accessible under the Reports section and can be filtered, sorted, and exported as needed. Read the help doc for more details.
2. Tag Variables Report
See tag and variable details for all your tags, across all your pages.
What It Is
A report that combines tag inventory and variable details across all Audits in your account.
Why You’ll Like It
- Get complete visibility into every tag, variable, and value loaded on your sites.
- Verify which data points are being collected to support privacy audits and legal compliance efforts.
- Empower cross-team collaboration by giving developers, marketers, and analysts a shared source of truth on what’s being tracked.
- Catch analytics mistakes or incorrect variable values at scale to safeguard data accuracy. For example, you could pick an Adobe Analytics variable and see if that variable has consistent values across all pages.
How It Works
View all tags, variables, and values in a centralized place. Read the help doc for more information.
3. Network Request Report
Get deeper visibility into request-level behavior across your sites.
What It Is
A complete view of every network request across all your web pages and websites, from pixels to JavaScript files, to API calls.
Why You’ll Like It
- See every network request on every page in one place.
- See which network requests are going to which countries.
- See network request start times relative to Web Vitals and other key events, to find out which requests are slowing down the user experience.
- Pinpoint failed image, video, or script requests by status code or MIME type to detect broken site content. See what content is failing, why, and who’s responsible (vendor, tag, domain).
- Get transparency on file type and payloads–JS, images, JSON, fonts, and more–and analyze their size, encoding, and purpose.
- See the cookies set by each network request.
- See which pages are generating network requests to unapproved countries or domains.
How It Works
The report is available via the Reports screen, showing one row per request. Report includes:
- Page-level context (Audit ID, Page ID, HAR index)
- Timing relative to key lifecycle events
- Full URL breakdown (domain, path, query, fragment)
- Request and response metadata (status, type, size, cookies set)
- Consent alignment, country code, and server IP address
- Error or success indicators
Example template reports are provided to help users get started. Read the help documentation for more details.
NEW REPORT FEATURES
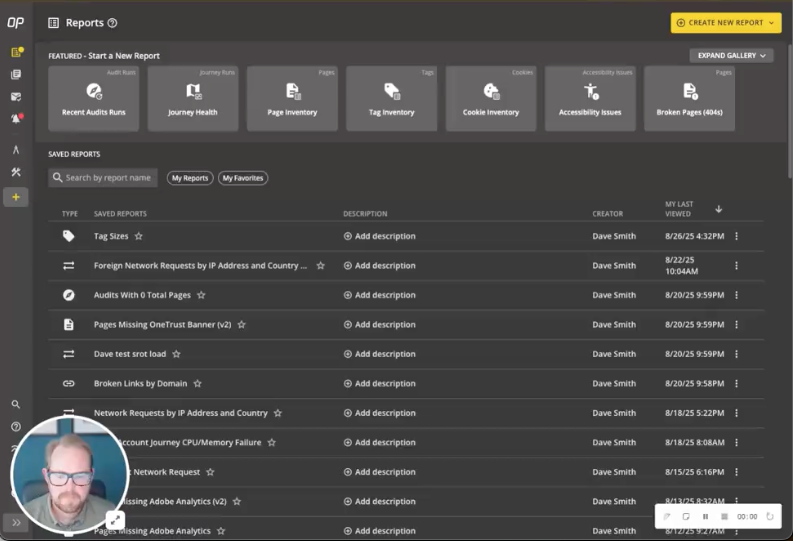
1. Scheduled Reports
Schedule ObservePoint to automatically deliver reports to any email address.
What It Is
Users can take any saved report and schedule it as an export.
Why You’ll Like It
- Eliminate hunting for information, by having ObservePoint proactively send you the data on your schedule.
- Accelerate insights across systems by syncing ObservePoint data with BI tools or internal dashboards.
- Get ObservePoint data delivered like clockwork, so stakeholders stay consistently informed to make faster, smarter decisions.
- Control and customize reporting to your preferred cadence, whether daily, weekly, or monthly, so your reporting aligns with your team’s workflow.
How It Works
Use the scheduler to choose dates and times for export. From each saved report, use the Share & Export menu to make changes or create new ones. Read the help doc for more information.
2. Public Link Sharing
Share grid reports without friction through a secure URL.
What It Is
The ability to share Saved Grid Reports externally or internally with a simple link, without requiring recipients to log in or gain full folder access.
Why You’ll Like It
- Allows view-only access to a Saved Report with a secure sharing URL.
- Works without requiring the recipient to log in.
- Shared reports are always current, reflecting the latest runs and updates
How It Works
Go to the Share & Export button on the top right and select “Share a Public Link.” Then you can generate a public link and input the recipient’s email. Sharing is disabled for accounts that have disabled public sharing. Recipients are restricted to the shared report only. Read the help doc for more details.
3. Column Descriptions and Colors
Understand which columns report what at a glance.
What It Is
Helpful descriptions, color-coding, and hover menus were added to report columns so users can easily understand the purpose and content of each column.
Why You’ll Like It
- Get instant clarity on what each metric means – no more guessing or trial-and-error.
- Color-coded values highlight performance issues like slow load times or Web Vitals.
How It Works
In the column picker and the main report table, hover over a column to see a detailed description of that column. . Column values that have thresholds have been colorized red, green, or yellow to make it easy to spot problems.
ACCOUNT-LEVEL DATA LAYERS
Make data layer configurations once for all your Audits & Journeys.
What It Is
A simplified way to define and configure data layer names at the account level instead of at the folder level.
Why You’ll Like It
- Create consistency by defining your key data layer names once and having every Audit or Journey in your account automatically pick them up.
- Save time with bulk updates or removals, so you don’t have to repeat tasks.
How It Works
Account-level Data Layer configurations is now located under the Configuration menu. Users can add or remove data layer names in this section. Once defined, all Audits and Journeys within the account will automatically report these specified data layer items. The interface also provides options for bulk removal and updating of these data layer configurations. Read the help doc for more information.
Hope you enjoyed this feature round-up. Stay tuned for more releases as we continue to improve the platform for your business needs. If you aren’t a customer yet, hop on over to a Free Trial and explore ObservePoint for yourself.