If the integrity of your web analytics data suffers, so does your ability to do your job as a web analytics professional. Regularly testing your analytics implementation is an important aspect of data governance to ensure your data is accurate, so that your company can make good data-driven decisions. Here are three tools to test the data integrity of your web analytics implementation:
- Developer tools: Checking network requests
- Tag debugger: Spot checking tags on the page
- Automated web analytics audit: Checking all of your tags throughout the site
1. Developer Tools
The most basic way to test your web analytics tags is by using your browser’s developer tools. Specifically, you’ll be working in the Network tab in your dev tools. This technique is available on any browser, however the drawbacks are that testing this way is a very manual process that’s prone to human error.
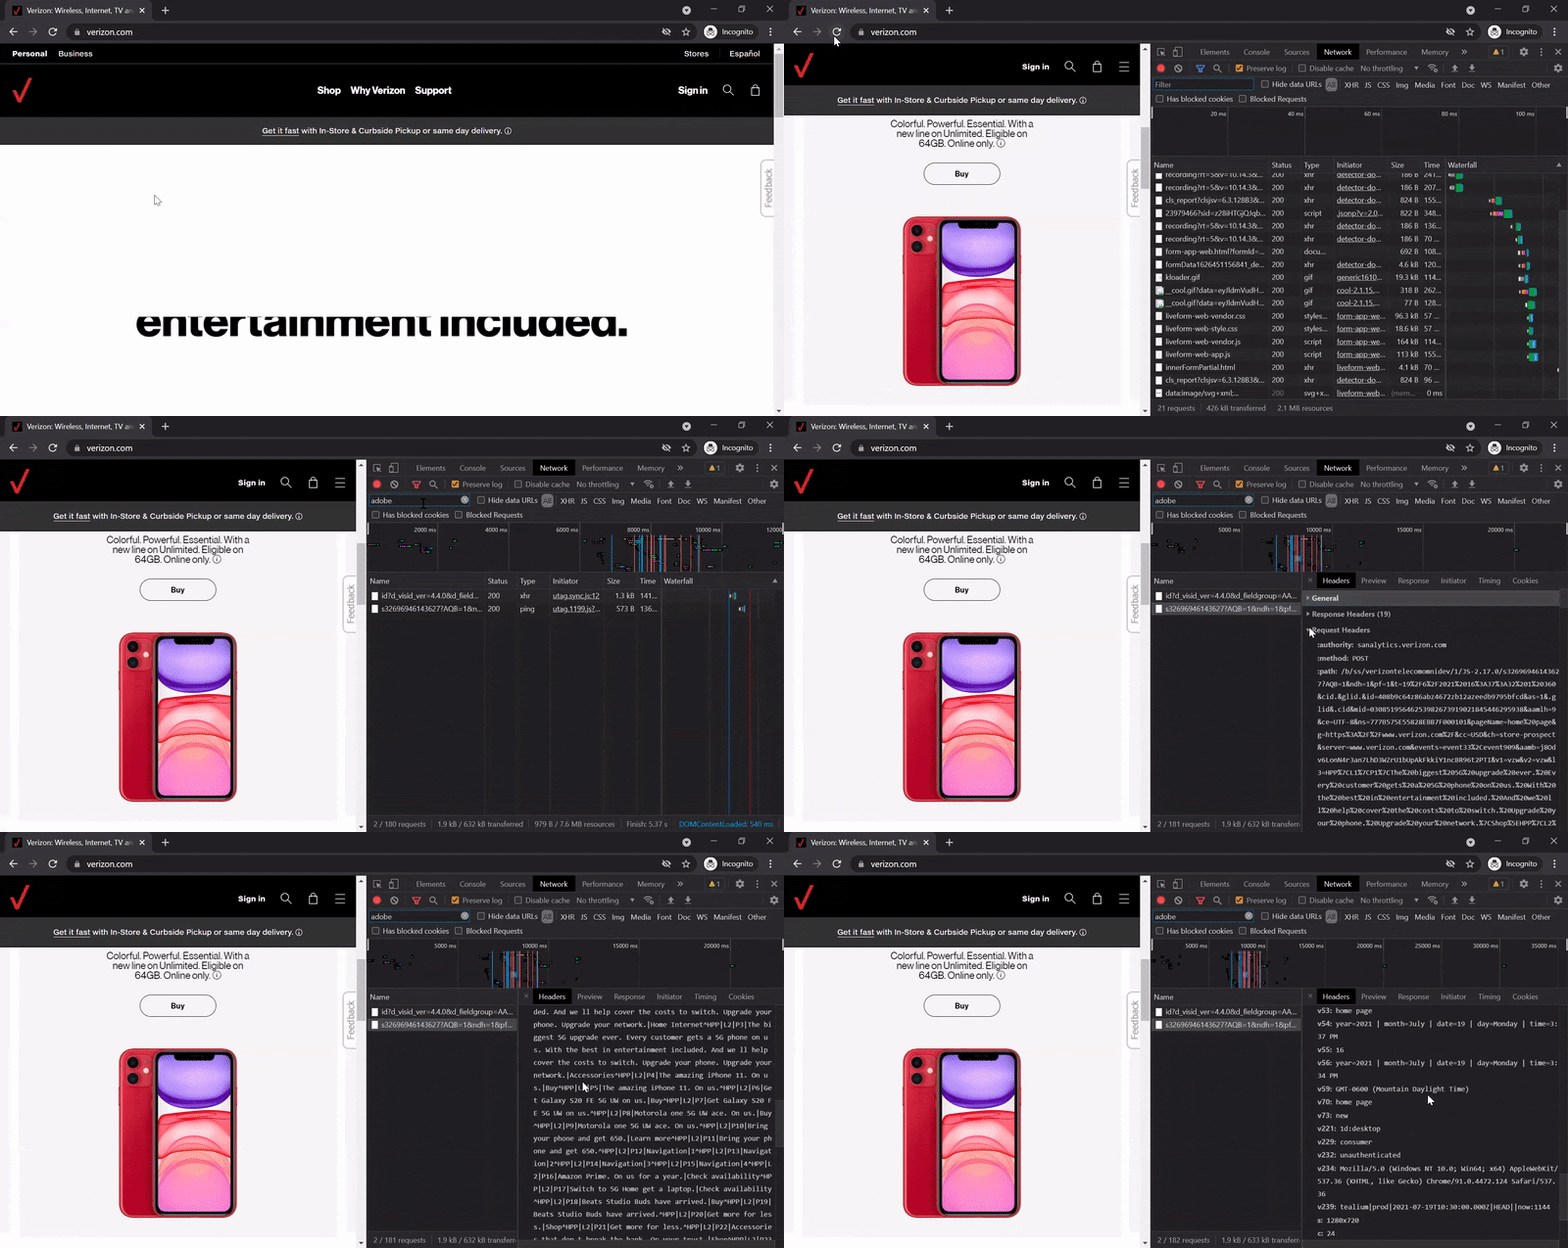
To illustrate why analysts prefer to use the subsequent techniques over this one, here is the basic process for debugging a network request using your dev tools.
Locating the tag in dev tools
- Open your browser’s developer tools in Chrome, Firefox, or Safari.
- Navigate to the Network tab.
- Initiate the action that should trigger your tag to fire, such as a page load or an interaction event.
- Locate the network request that should result from that event. Finding the request is most difficult the first time. Common ways to find the request are by filtering the list for terms related to your analytics platform (like “adobe”).
Once you’ve located the tag in dev tools, then you can start debugging.
Debugging the analytics request
- Select the request and scroll down to the section that says Query Parameters (assuming data is being passed via query parameters and not via POST payload).
- Select “View Decoded” to decode the URL character encoding.
- Locate the variables you want to check and verify those variables are present and contain the values you expect.
Below is what the full process might look like:

As you can see, this process is not particularly intuitive and would be tedious to repeat. Thankfully, you can use a tag debugger to check individual requests more efficiently.
2. Tag Debugger
ObservePoint’s TagDebugger is a free Google Chrome extension that enables you to debug the analytics requests that are collecting data on your site. It can show you all of the vendors that are firing tags on your site. The debugger parses your analytics network requests so you can easily see your variables and values.
After you install the TagDebugger in Chrome, here are the basic steps to use this free tool.
How to use ObservePoint’s TagDebugger
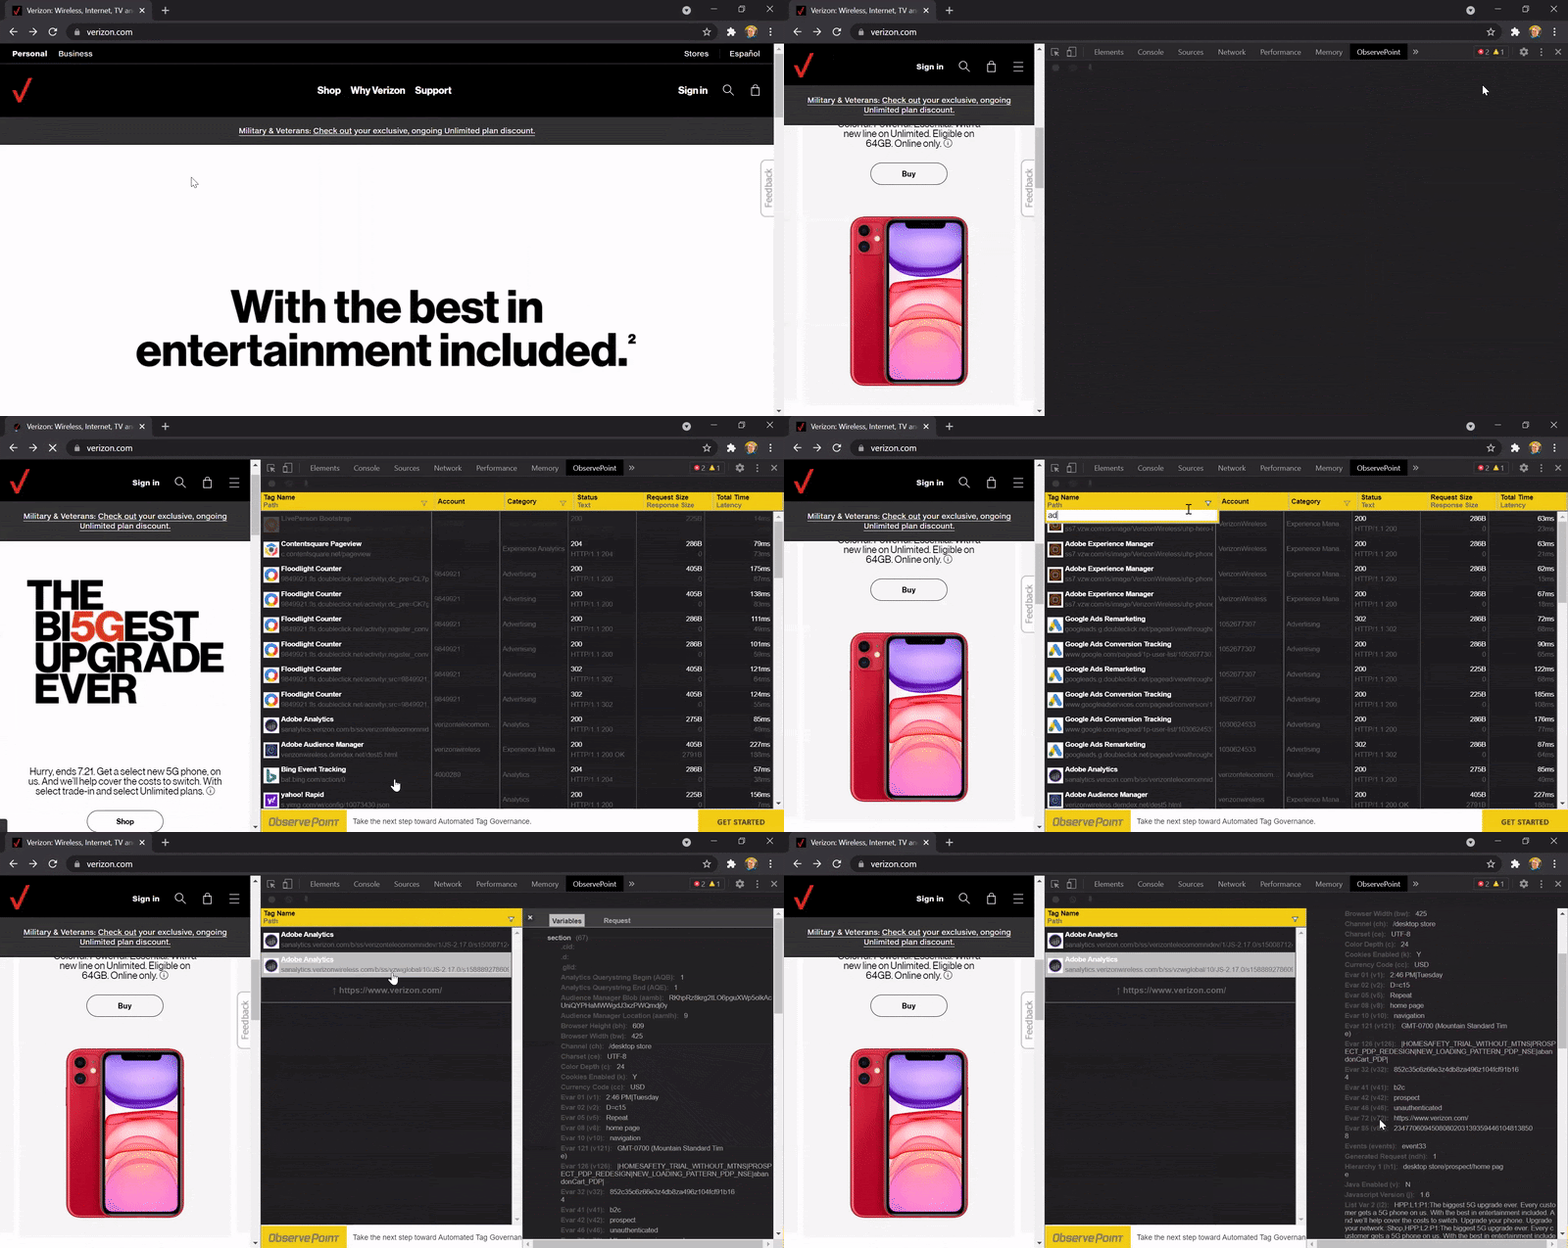
- Open the Chrome Developer tools.
- Click the new tab that says “ObservePoint.”
- Refresh the page. You should start seeing the tool capture and parse recognized network requests.
- To filter for any requests, click the filter button on the Tag Name column and type in the name of the vendor or technology. You’ll be able to see high-level data about the tag like the account, category, and status.
- To see specific variables in the network request, click on the analytics tag you’re interested in. You’ll then be able to view which variables are present in the request and the data contained in each variable.
Here is what that process would look like:

Upgrading from manually reviewing network requests to using a TagDebugger is great for spot-checking your implementation, but it’s not that great for full scale audits or for regular check-ups on the important pages of your site.
For that, you should try the third technique for web analytics testing.
3. Automated Web Analytics Audit
An automated audit is the most powerful way you can keep an eye on your analytics and other MarTech implementations. You can configure it to run on a set schedule, so you don’t have to remember to do this important housekeeping task that protects your company’s revenue and reputation. You can set up alerts to get notified if something is broken or unauthorized, so you can quickly find and fix any errors.
ObservePoint’s Technology Governance platform makes automated audits possible. Here’s a quick walkthrough of how the Audits, Journeys, and Rules features work. When you combine them all together, they become an extremely useful tool to find errors, lags, and unauthorized tech that might be impacting your site’s performance and tracking.
Audits are scans of your website to check which technologies are present and what they’re doing. Audits crawl through the code of your site and report what tags are present, what data they’re collecting, and where they’re sending it.
Journeys let you define important paths through your site that you want to test, such as shopping carts or logins, to see if everything is tracking and no obstacles are preventing a conversion.
Rules let you test tags, variables, and values by comparing what’s on your site with what you expect them to be. Combining filters and conditions will let you test with accuracy.
Ensure Your Web Analytics Implementation Is Always Working
You spend a lot of time and money on your analytics platforms, so you want to make sure you get the best return on your investment. Regular audits can help you realize the return you’re hoping for.
You can download our free TagDebugger, or if you’re interested in seeing the current state of your web analytics implementation across your site, schedule your free Web Analytics Audit.


